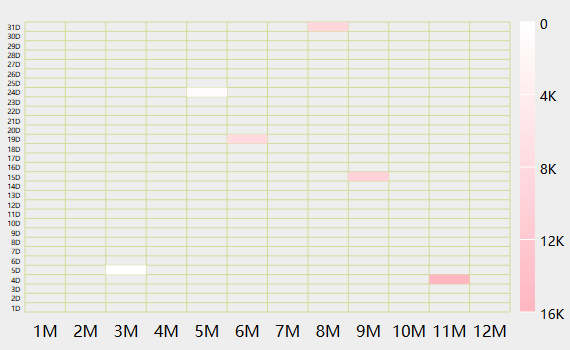
本插件是一个基于笛卡尔坐标系的热力图.
将对应坐标点的数据所对应的颜色以色块的形式展示,最终这些数据会组合成一个坐标系形式的表格。
最右侧展示了所有颜色的过渡。并在鼠标选中一个数据块时,显示对应的值在过渡色中的位置。
更多详情请试用插件。
[2024-12-06] 1.3.0
1. support multi plugins
[2023-08-28] 1.2.0
1. tips support formula
[2023-06-19] 1.1.0
1. label support multi lines
[2023-05-06] 1.0.0
1. support transparent background
[2021-09-11] 0.3.6
1. fix for fr11
[2021-09-02] 0.3.5
1. remove formula text field
[2021-08-23] 0.3.4
1. fix sort
[2021-05-17] 0.3.3
1. fix author
[2021-05-17] 0.3.2
1. use chinese
[2021-05-17] 0.3.1
1. show tooltip
[2021-01-05] 0.2.5
1. support fineui
[2020-04-01] 0.2.4
1. fix can't show dialog after fulldisplay
[2020-04-01] 0.2.3
1. fix can't save js for custom label
[2019-09-09] 0.2.2
1. use chinese name
[2019-6-21] 0.2.0
1. compatible with FR10
[2018-12-4] 0.1.4
1. fix env-version
[2018-11-28] 0.1.3
1. fix function recorder
[2018-11-28] 0.1.2
1. fix can't renderer after search
[2018-11-23] 0.1.1
1. add function record
2. add pay authorize
[2018-11-23] 0.1.0
1. show labels for unsupport realtime dataset
[2018-11-22] 0.0.9
1. fix custom label not trigger dirty
2. change update label string
[2018-10-29] 0.0.8
1. rename plugin
[2018-10-26] 0.0.7
1. fix custome hyperlink
[2018-10-25] 0.0.6
1. fix highlight color
2. fix custome axis
3. config chart/draw area background
[2018-10-22] 0.0.5
1. more config for eheatmap
[2018-10-08] 0.0.4
1. fix locale
[2018-10-07] 0.0.3
1. fix image
[2018-10-07] 0.0.2
1. fix FR10 issue
[2018-09-30] 0.0.1
1. init version


